TE_41
Basic information Differential Expression Stage analysis Survival analysis Correlation analysis| TE family | L2a_3end |
|---|---|
| TE superfamily | L2 |
| TE order | LINE |
| Gene | GFOD3P |
| Class | Annoated |
| Coding | Non-coding, Other |
| Tumor-specific score | 0.82 |
| Counts of samples | TCGA_tumor:4085; TCGA_normal:381; GTEx:5240 |
| TSS | chr1(-):3745485 |
Transcript isoforms
| Transcript_ID | Gene | Class | Coding | ORF | Position |
|---|---|---|---|---|---|
| teRNA_41.1 | GFOD3P | Annoated | Other | MLLGEATPDTVFSLGHVFCPDMAALKDADAVVISMKFPCEAVVSVDISQHCTDSCDQDVSQHCTDSCDQRLEGVLESPFLRSMWHPLAEGTSRIPPLPV* | chr1(-):3736538,3736558,3736926,3737103,3740233,3740387,3742804,3742911,3743061,3743190,3745381,3745486 |
| teRNA_41.2 | GFOD3P | Annoated | Non-coding | Non-coding | chr1(-):3740367,3740387,3742804,3742957,3743061,3743190,3745381,3745486 |
1
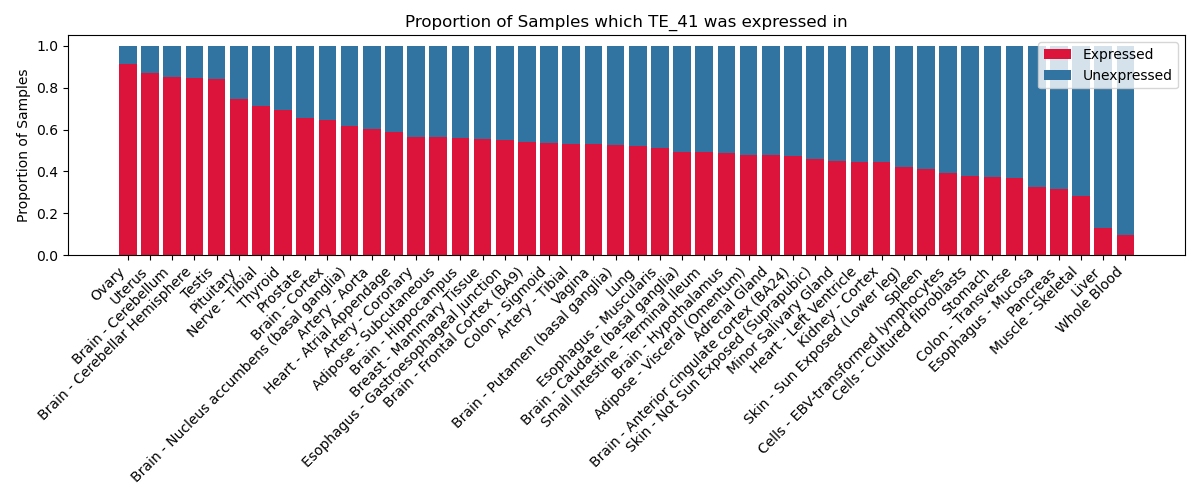
GTEx
The proportion of samples in which the TE-initiated transcript was expressed across 46 body sites in the Genotype-Tissue Expression (GTEx) project.
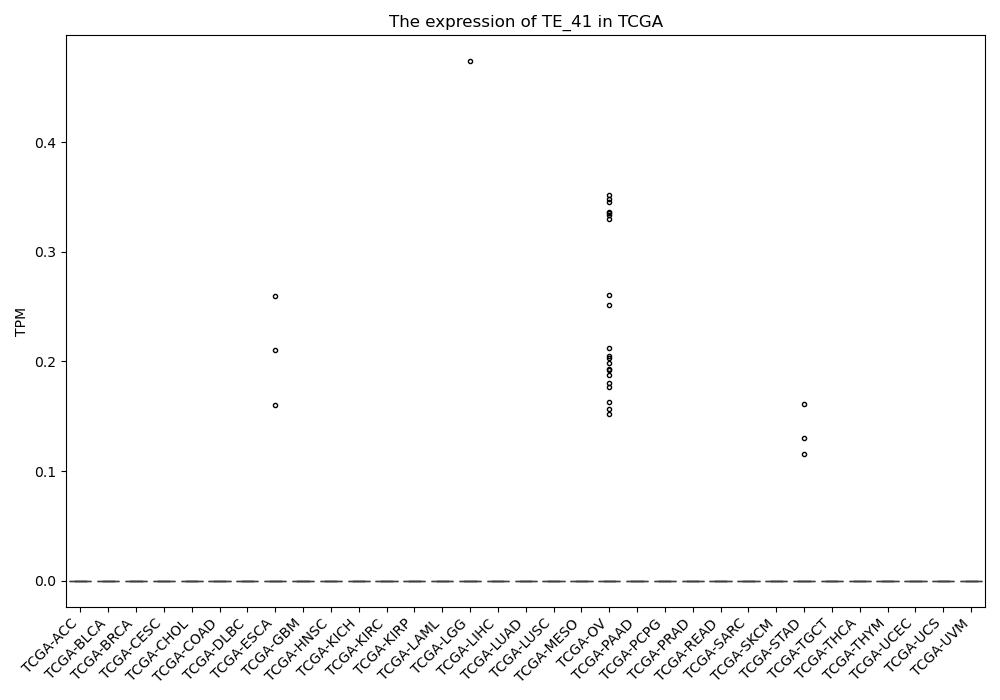
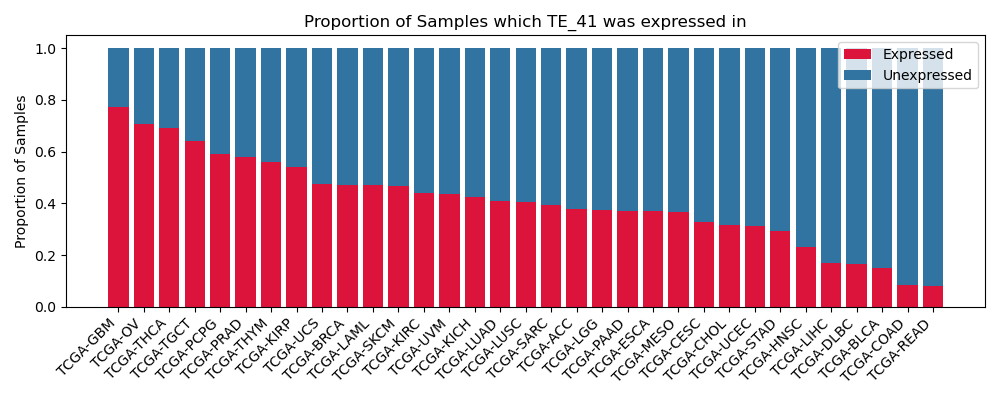
TCGA
The proportion of samples in which the TE-initiated transcript was expressed across 33 cancer types from The Cancer Genome Atlas (TCGA).
GTEx
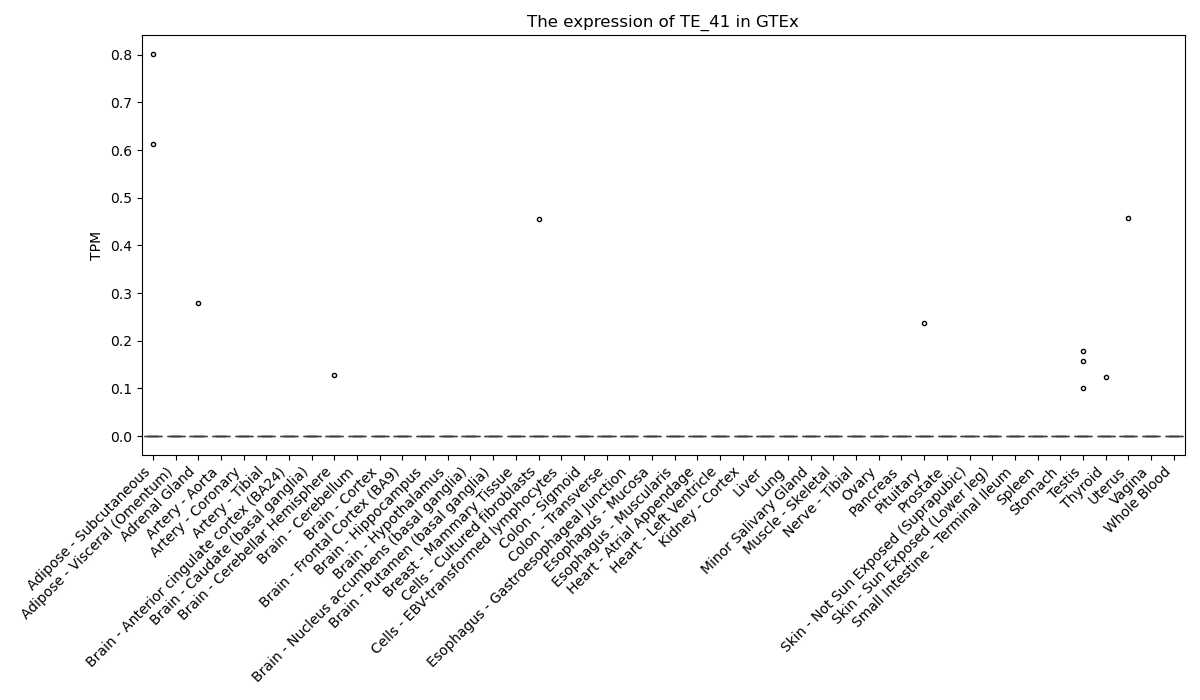
The expression of TE-initiated transcript across 46 body sites from The Genotype-Tissue Expression (GTEx) project.