1. Introduction to TEITbase
TEITbase is a database of transposable element (TE)-initiated transcripts in human tumors. The current version includes 38,995 TE-initiated transcripts, of which 4,325 are annotated and 34,670 are unannotated (comprising 22,553 chimeric and 12,117 intergenic transcripts). Annotated transcripts are defined as those that exactly match known isoforms in GENCODE v.46. Chimeric transcripts contain at least one novel splice site, while intergenic transcripts lack any known splice sites.
2. The identification of TE-initiated transcripts
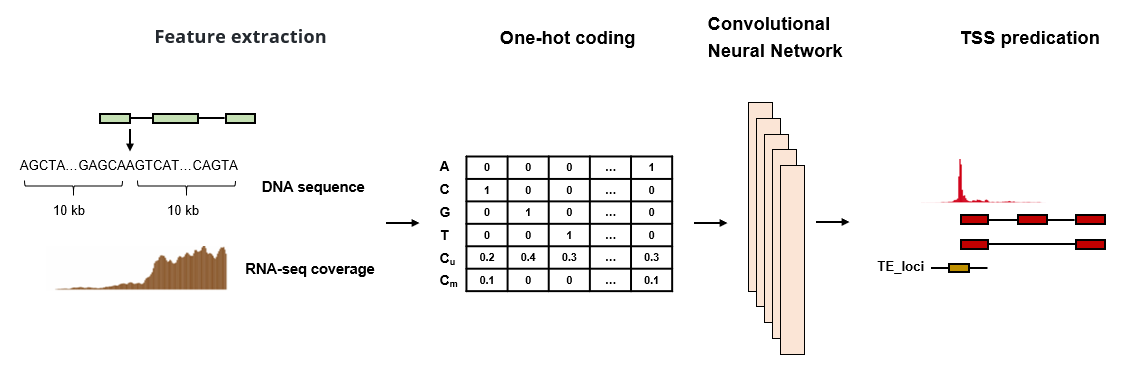
To identify TE-initiated transcripts, we first developed a deep learning-based method to predict transcription start sites (TSSs) for each assembled transcript, utilizing both DNA sequences and short-read RNA sequencing data. Subsequently, we applied this method to 10,079 tumor samples from The Cancer Genome Atlas (TCGA) to identify TE-initiated transcripts through TSS correction and overlap with TE annotations. To exclude TE exonization and ensure accuracy, we retained only those TE-initiated transcripts whose first exons did not overlap with any internal exons and that were identified in at least 20 tumor samples.
3. The quantification of TE-initiated transcription
The quantification of TE-initiated transcription was conducted at three levels.
Transcript-level: The expression of TE-initiated transcripts (transcripts per kilobase million, TPM) was calculated at the transcript level using StringTie.
Junction-level: To distinguish the expression of TE-initiated transcripts from other annoated transcript isoforms, we calculated the count of junction reads supporting the first exon of TE-initiated transcripts. A count greater than zero indicates the expression of the TE-initiated transcript in the sample.
Family-level: Considering that TE-initiated transcripts from the same TE family may exhibit similar expression patterns and regulatory mechanisms, we merged the junction read counts at the TE-family level and normalized them using the library size.
4. The Browse page
In the browse page, users can browse an integrative information of the TE-initiated transcription, including the family-level and transcript-level.
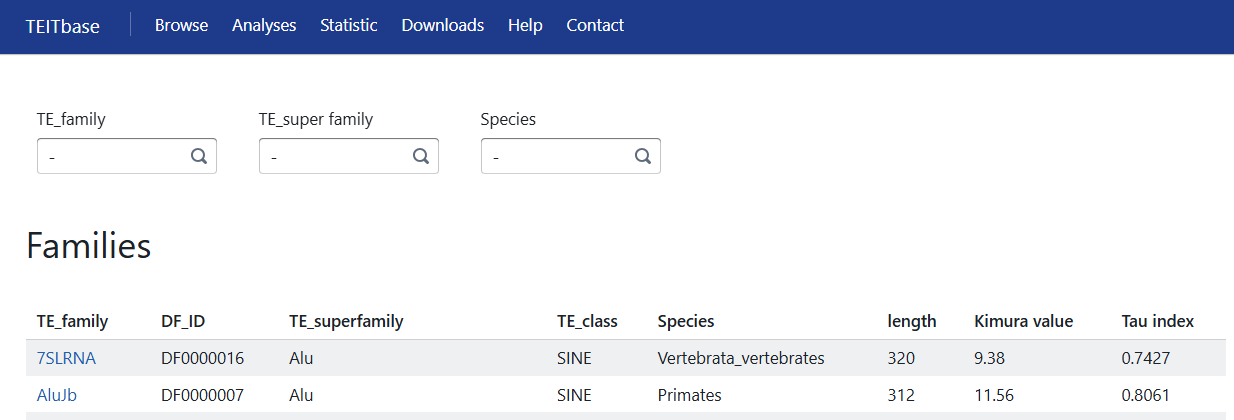
Users could search the database by TE family, TE superfamily, and species. The family-level information page is displayed as follows:
1. TE family.
2. DF ID of the TE family.
3. TE superfamily of the TE family using the Dfam classification system.
4. TE class of the TE family using the Dfam classification system.
5. Species: In most cases this will be the oldest clade in which copies of the family have been found at orthologous positions, meaning that the transposable element was active before the first speciation of extant species in this clade.
6. Length of the consensus sequence of the TE family.
7. Kimura value: The median Kimura two-parameter distance of the TE family, calculated using RepeatMasker.
8. Tau index: A previously proposed metric used to evaluate tissue specificity, ranging from 0 for housekeeping TE-family to 1 for tissue-specific TE-family.
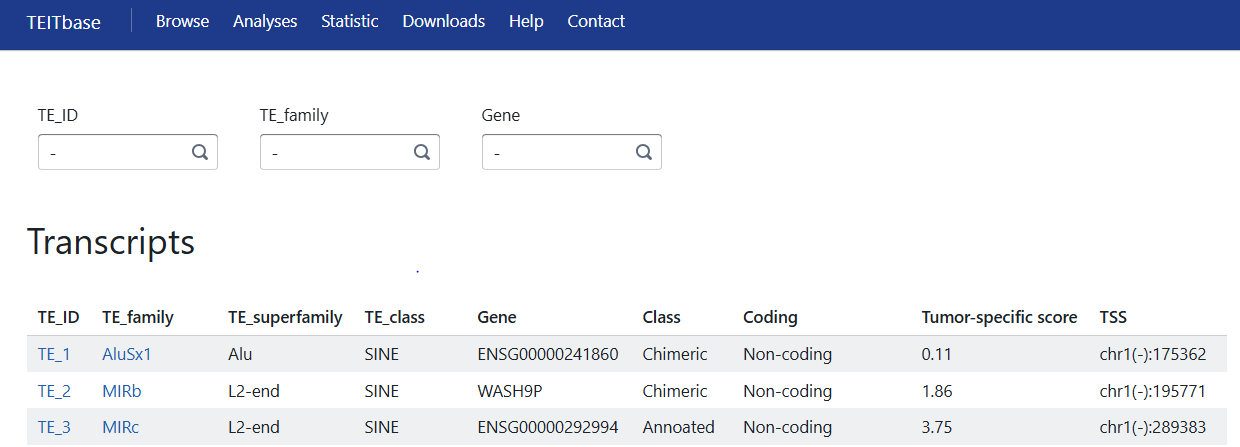
Users could search a TE ID, gene symbol or TE family to identify associated TE-initiated transcripts. The transcript-level information page is displayed as follows:
1. TE ID: ID of the TE-initiated transcript.
2. TE family of the TE-initiated transcript.
3. TE superfamily of the TE-initiated transcript.
4. TE class of the TE-initiated transcript.
5. Gene: For annotated or chimeric TE-initiated transcripts, genes that share at least one splicing site.
6. Class: Transcript class in comparison to the reference (annotated, chimeric, and intergenic)
7. Coding: Based on the presence of predicted open reading frames (ORFs) and comparison to the reference, TE-initiated transcripts were classified as annotated, chimeric_normal, truncated, chimeric truncated, other, and non-coding.
8. Tumor-specific score: The ratio was calculated by dividing the proportion of tumor samples in which TE-initiated transcript was expressed by the proportion of normal samples (excluding testis) in which the TE-initiated transcript was expressed.
9. TSS: The position (0-based) of the transcription start site of the TE-initiated transcript.
5. The Analyses page
In the Analyses section, we present four analytical functions. These functions allow users to analyze tumor-specific TE-initiated transcripts, identify differentially expressed TE families or TE-initiated transcripts between tumors and paired adjacent normal tissues, and examine survival- and stage-associated TE families or TE-initiated transcripts in cancer patients. Users can apply various filtering criteria to obtain their desired results.
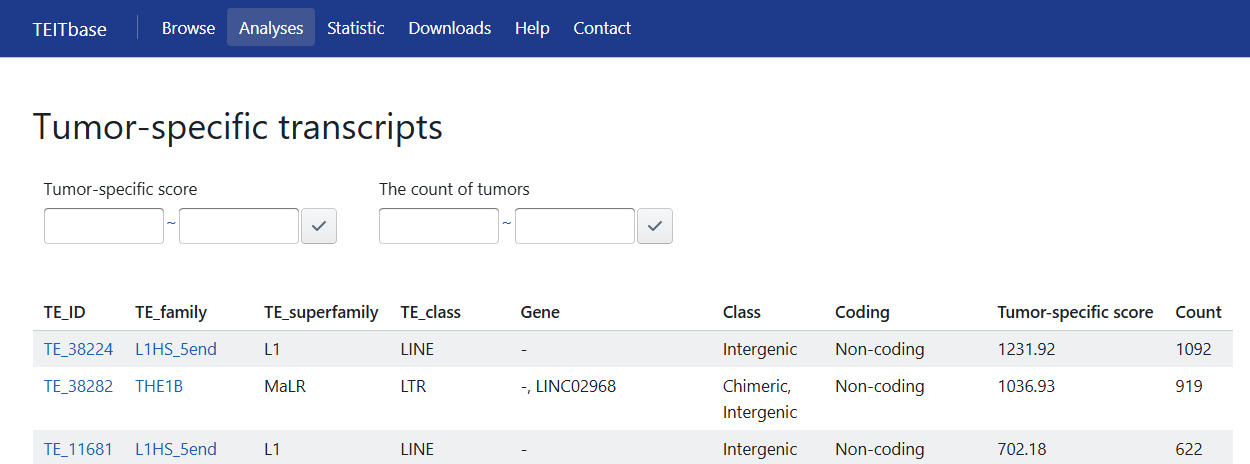
5.1 Tumor-specific TE-initiated transcripts
Tumor-specific TE-initiated transcripts are defined as those with a tumor-specific score greater than the threshold. Tumor-specific score was calculated as follows:
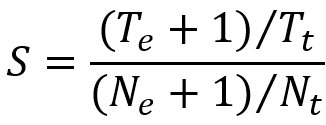
Here, Te represents the number of tumor samples expressing the TE-initiated transcript, Ne represents the number of adjacent or normal tissue samples (excluding testis) expressing TE-initiated transcripts, Tt and Nt represent the total number of tumor and normal samples, respectively.
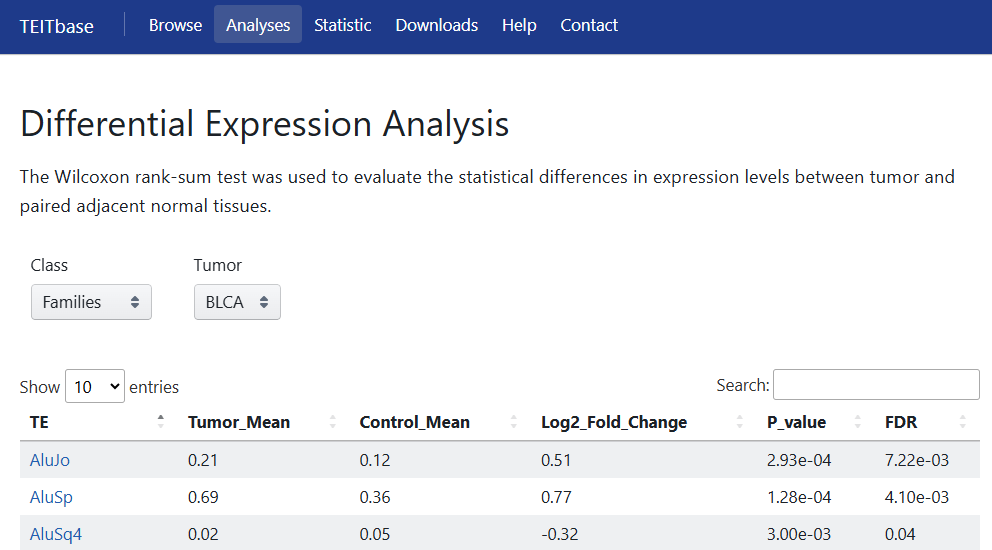
5.2 Differential Expression Analysis
The Wilcoxon rank-sum test was used to evaluate the statistical differences in expression levels of TE families and TE-initiated transcripts between tumor and paired adjacent normal tissues. To account for multiple comparisons, the Benjamini-Hochberg method was applied for multiple testing corrections. Users can obtain the corresponding results by selecting the Class (family or transcript level) and cancer type.
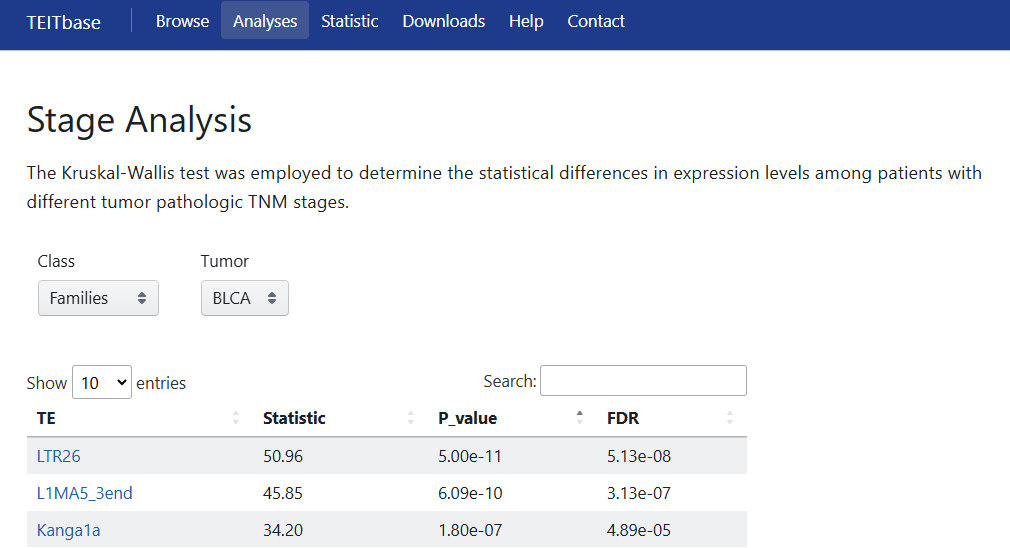
5.3 Stage Analysis
The Kruskal-Wallis test was employed to determine the statistical differences in expression levels among patients with different tumor pathologic TNM stages. Users can obtain the corresponding results by selecting the Class (family or transcript level) and cancer type.
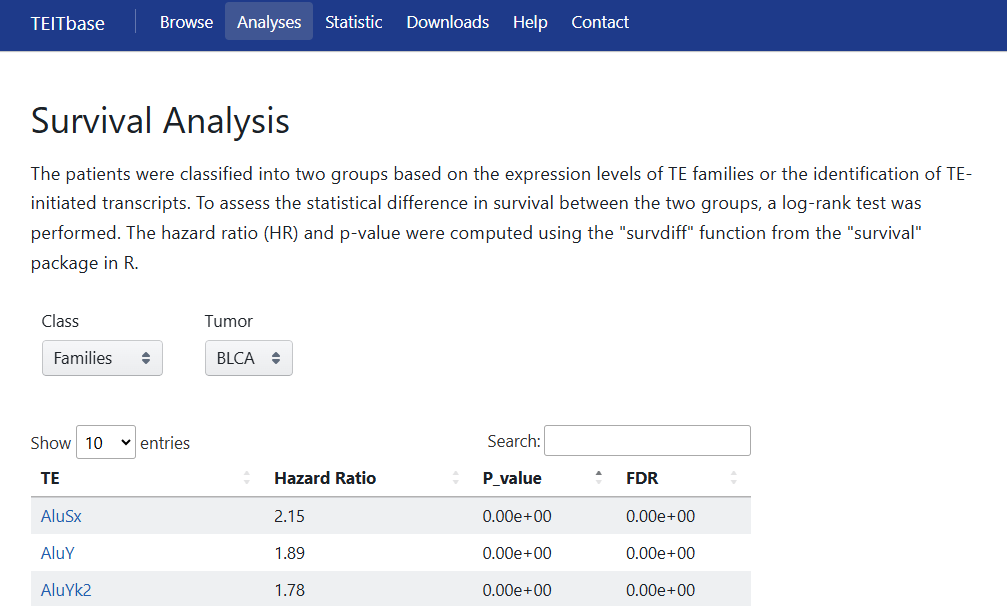
5.4 Survival Analysis
The patients were classified into two groups based on the expression levels of TE families or the identification of TE-initiated transcripts. To assess the statistical difference in survival between the two groups, a log-rank test was performed. The hazard ratio (HR) and p-value were computed using the "survdiff" function from the "survival" package in R. Users can obtain the corresponding results by selecting the Class (family or transcript level) and cancer type.
6. View the TE family
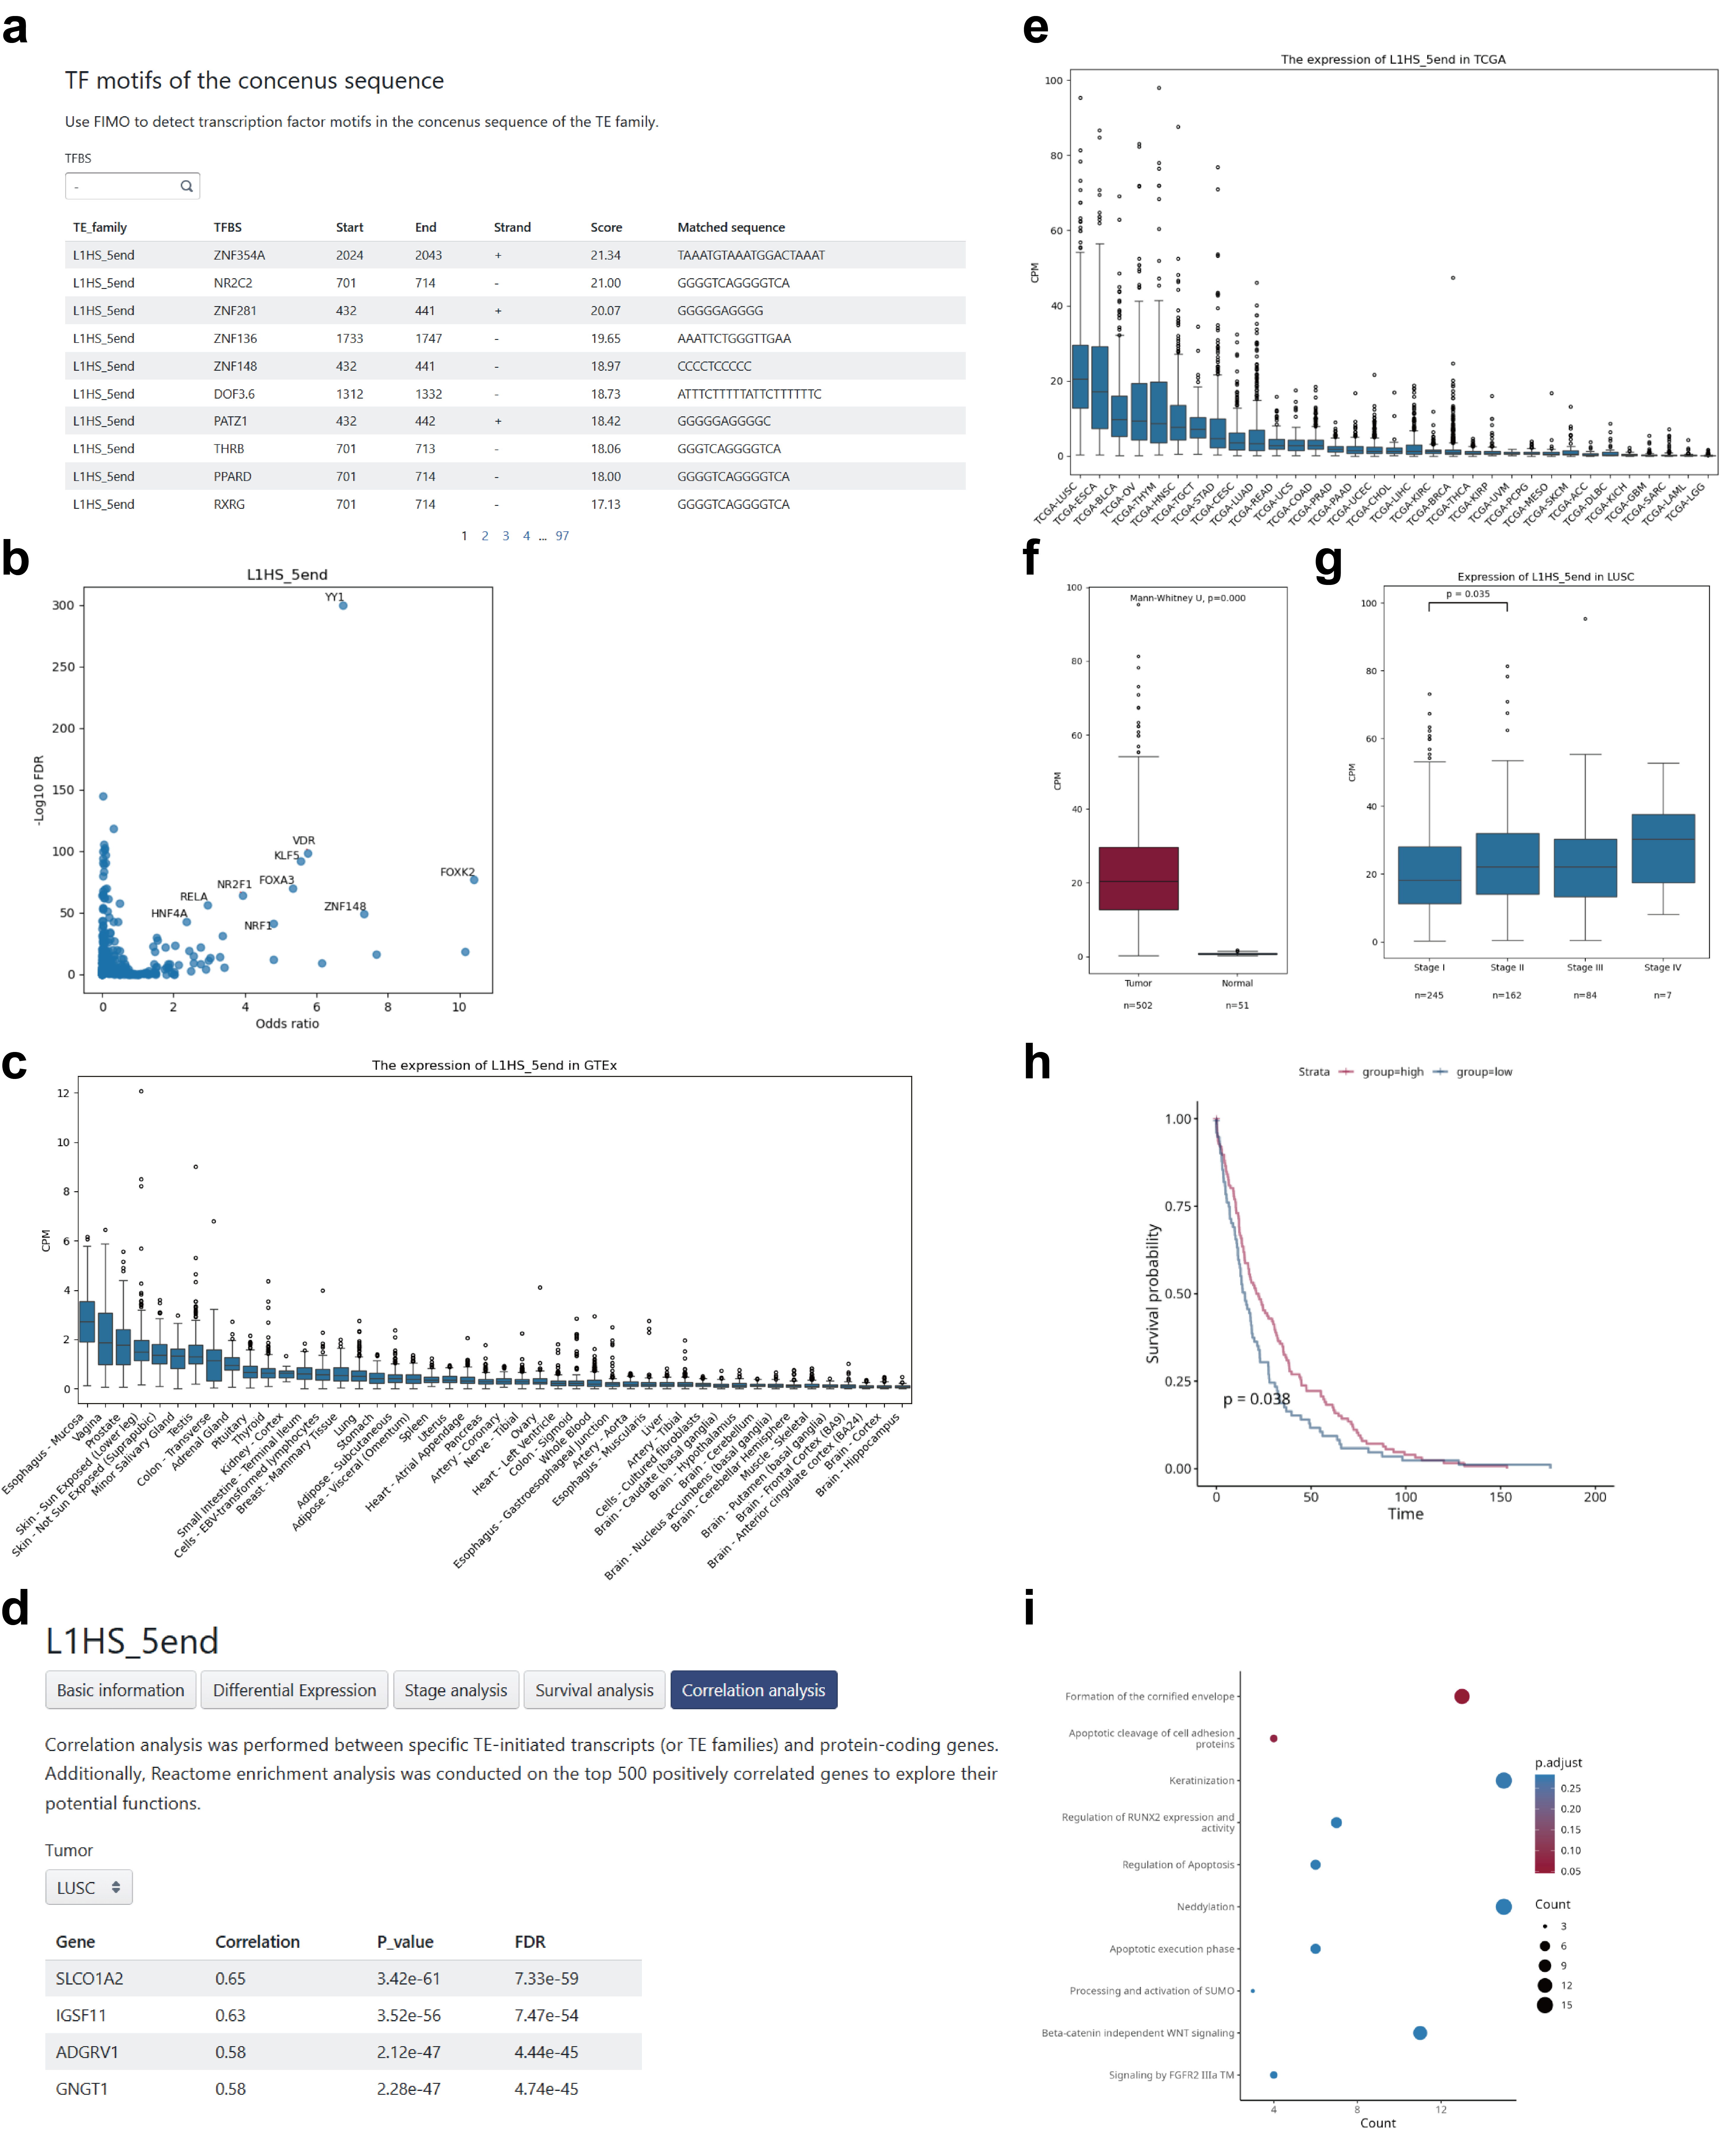
Users have the ability to explore the potential function of TE family, providing valuable information such as:
a. Transcription factor motifs in the concenus sequence of the TE family.
b. The enrichment analysis of transcription factor binding sites in the TE family of GRCh38.
c. The promoter activity of the TE family in GTEx samples.
d. The promoter activity of the TE family in TCGA tumor samples.
e. Box plot representing the promoter activity in a specific cancer type, comparing paired tumor and normal samples.
f. Box plot illustrating the promoter activity across different tumor stages.
g. Kaplan-Meier survival curve displaying the relationship between the expression levels of the TE family and survival in a specific cancer type.
h. The result of correlation analysis between TE family and protein-coding genes.
i. Bubble chart illustrating the result of Reactome enrichment analysis on the top 500 positively correlated genes.
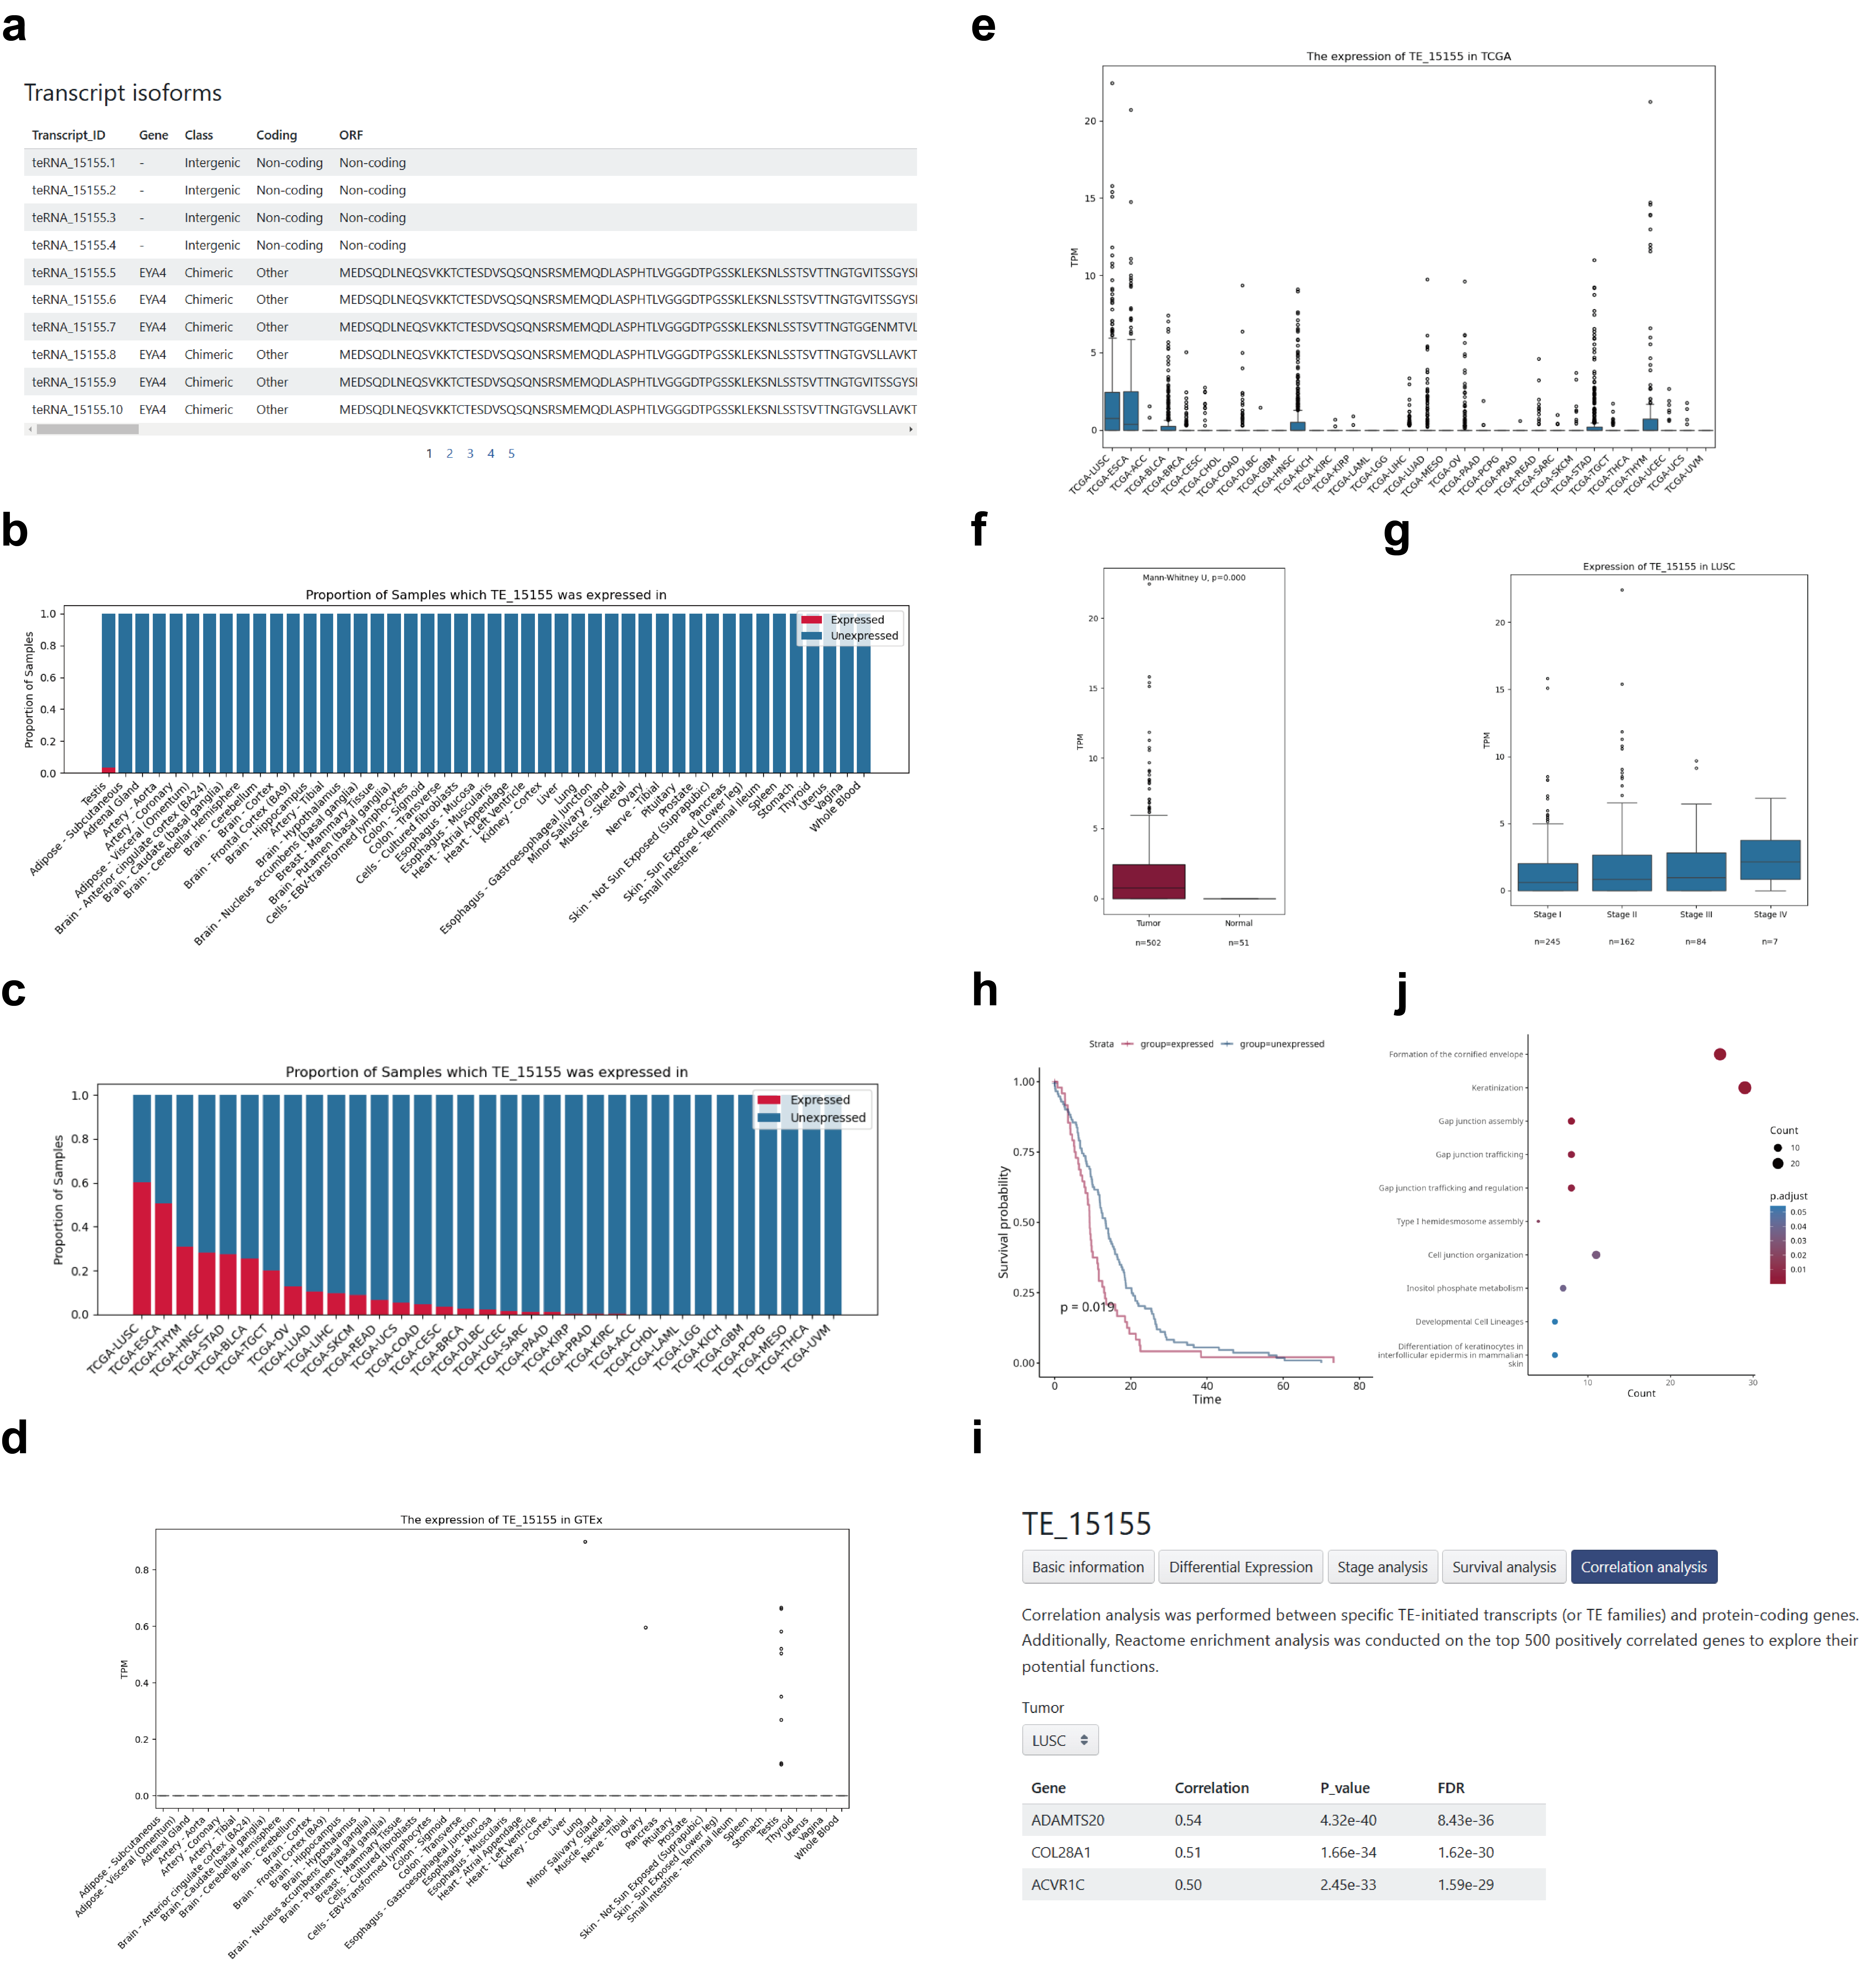
7. View the TE-initiated transcript
Users have the ability to explore the potential function of TE-initiated transcript, providing valuable information such as:
a. The basic information of transcript isoforms.
b. The proportion of GTEx samples in which the TE-initiated transcript was expressed.
c. The proportion of TCGA tumor samples in which the TE-initiated transcript was expressed.
d. The expression levels of the TE-initiated transcript in GTEx samples.
e. The expression levels of the TE-initiated transcript in TCGA tumor samples.
f. Box plot representing the expression levels in a specific cancer type, comparing paired tumor and normal samples.
g. Box plot illustrating the expression levels across different tumor stages.
h. Kaplan-Meier survival curve displaying the relationship between the expression levels of the TE-initiated transcript and survival in a specific cancer type.
i. The result of correlation analysis between TE-initiated transcript and protein-coding genes.
j. Bubble chart illustrating the result of Reactome enrichment analysis on the top 500 positively correlated genes.