TE_38993
Basic information Differential Expression Stage analysis Survival analysis Correlation analysis| TE family | L1P1_5end |
|---|---|
| TE superfamily | L1 |
| TE order | LINE |
| Gene | ENSG00000235583 |
| Class | Chimeric |
| Coding | Non-coding |
| Tumor-specific score | 3.76 |
| Counts of samples | TCGA_tumor:9; TCGA_normal:1; GTEx:1 |
| TSS | chrY(-):25531894 |
Transcript isoforms
| Transcript_ID | Gene | Class | Coding | ORF | Position |
|---|---|---|---|---|---|
| teRNA_38993.1 | ENSG00000235583 | Chimeric | Non-coding | Non-coding | chrY(-):25512376,25512396,25513125,25513173,25519679,25519737,25524021,25524110,25525204,25525288,25527649,25527786,25531744,25531895 |
| teRNA_38993.2 | ENSG00000235583 | Chimeric | Non-coding | Non-coding | chrY(-):25512376,25512396,25513125,25513173,25519679,25519737,25524021,25524110,25525204,25525288,25527665,25527786,25531744,25531895 |
1
GTEx
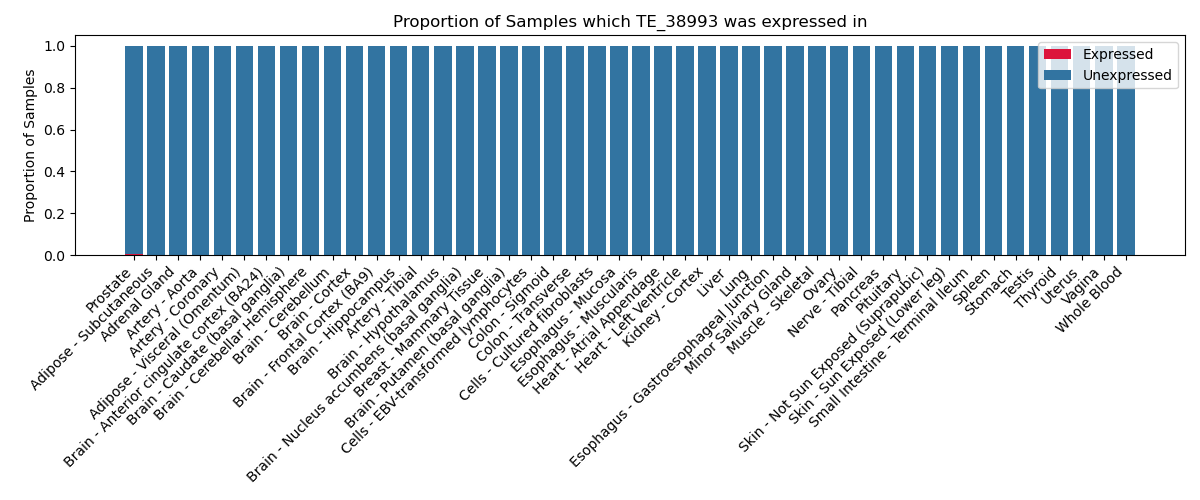
The proportion of samples in which the TE-initiated transcript was expressed across 46 body sites in the Genotype-Tissue Expression (GTEx) project.
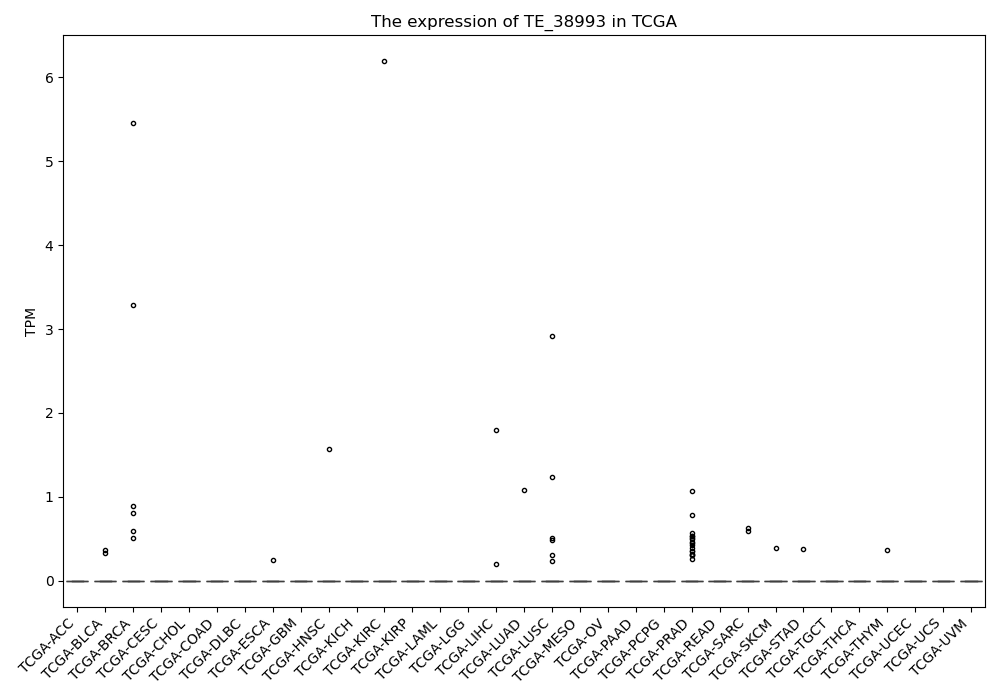
TCGA
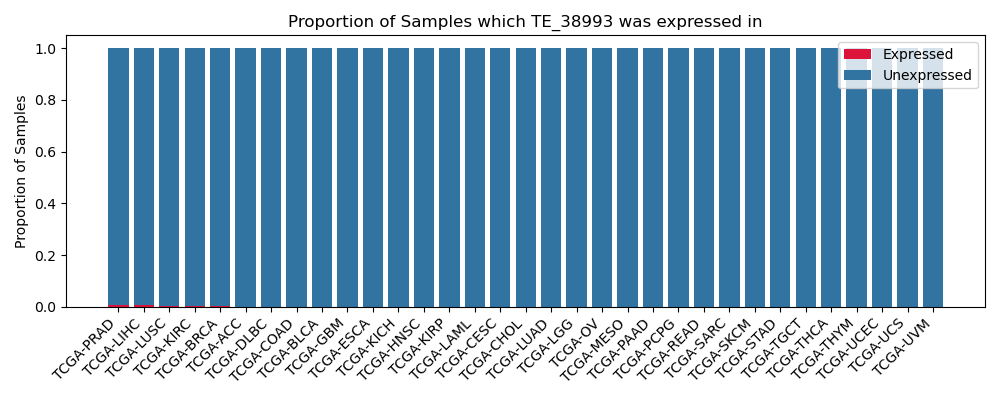
The proportion of samples in which the TE-initiated transcript was expressed across 33 cancer types from The Cancer Genome Atlas (TCGA).
GTEx
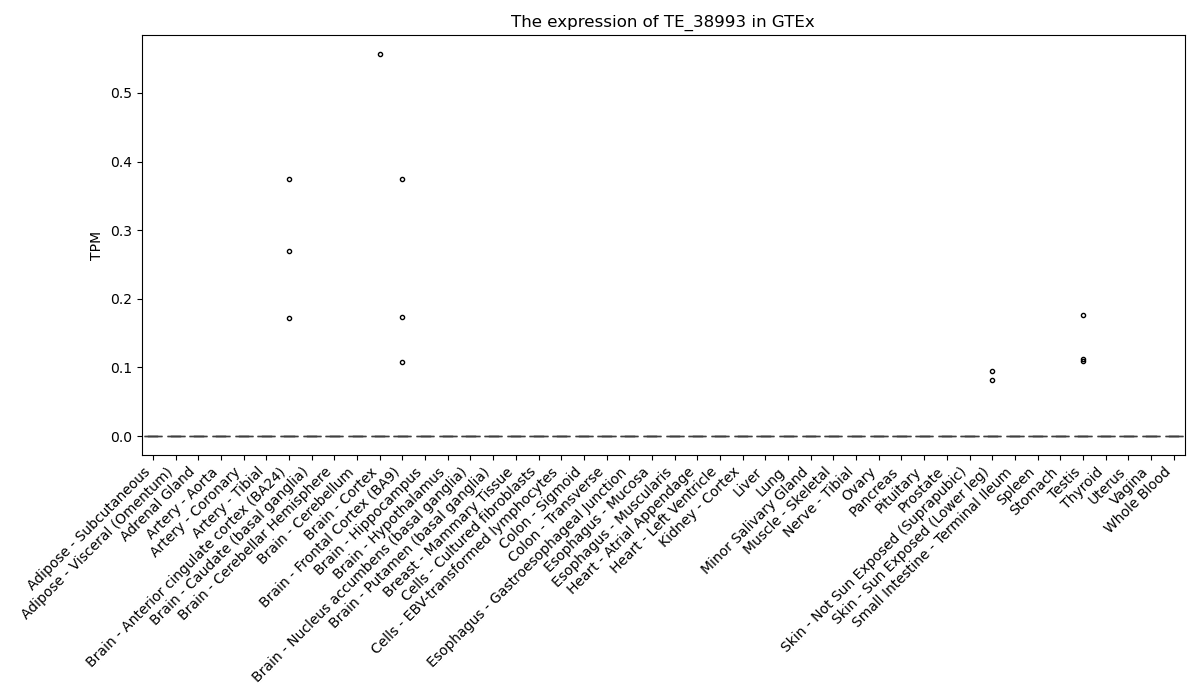
The expression of TE-initiated transcript across 46 body sites from The Genotype-Tissue Expression (GTEx) project.