TE_2869
Basic information Differential Expression Stage analysis Survival analysis Correlation analysis| TE family | L1HS_5end |
|---|---|
| TE superfamily | L1 |
| TE order | LINE |
| Gene | EMBP1 |
| Class | Chimeric |
| Coding | Non-coding, Other |
| Tumor-specific score | 227.67 |
| Counts of samples | TCGA_tumor:807; TCGA_normal:2; GTEx:1 |
| TSS | chr1(+):121537873 |
Transcript isoforms
| Transcript_ID | Gene | Class | Coding | ORF | Position |
|---|---|---|---|---|---|
| teRNA_2869.1 | EMBP1 | Chimeric | Other | MNKYVINGTYANETKLKITQLLEEDGGFYWCHALFQLDESEEHIELVVLSYLVPLKPFLAIVAEVILLVATILLCEKYTQKKKKHSDEGKEFEQIEQLKSDDSNGIENNVPRHRKNESLGQ* | chr1(+):121537874,121538001,121538323,121538420,121556510,121556696,121556931,121557019,121562228,121562355,121564637,121564913,121565764,121565797,121568147,121568201,121568776,121568796 |
| teRNA_2869.2 | EMBP1 | Chimeric | Non-coding | Non-coding | chr1(+):121537874,121538001,121538323,121538420,121552650,121552789,121556510,121556696,121556931,121557019,121562228,121562355,121564637,121564657 |
| teRNA_2869.3 | EMBP1 | Chimeric | Non-coding | Non-coding | chr1(+):121537874,121538001,121538323,121538420,121556510,121556696,121556931,121557019,121562228,121562355,121564637,121564913,121565764,121565797,121568147,121568201,121574291,121574311 |
| teRNA_2869.4 | EMBP1 | Chimeric | Non-coding | Non-coding | chr1(+):121537874,121538001,121538323,121538420,121556672,121556696,121556931,121557019,121562228,121562355,121564637,121564657 |
1
GTEx
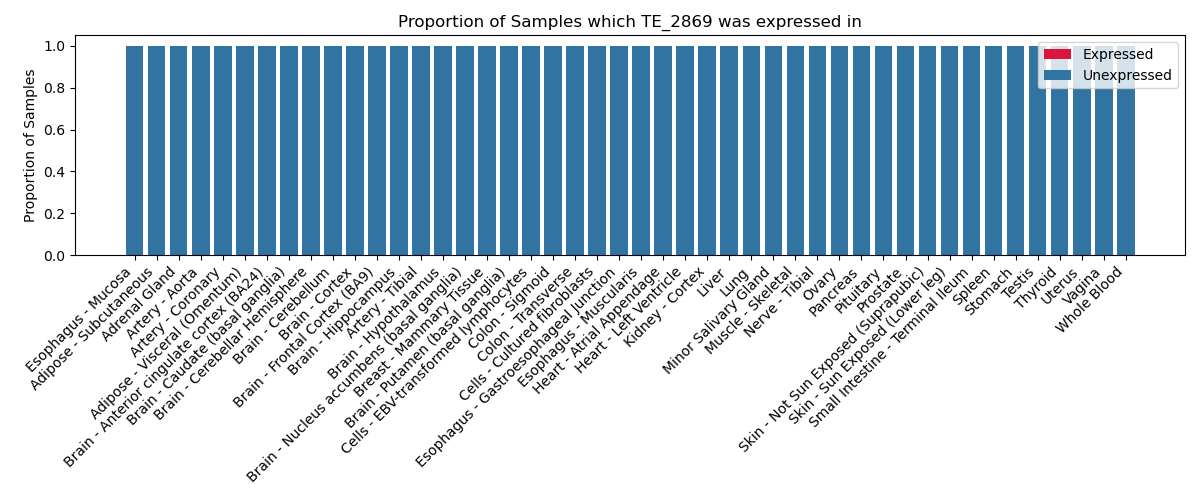
The proportion of samples in which the TE-initiated transcript was expressed across 46 body sites in the Genotype-Tissue Expression (GTEx) project.
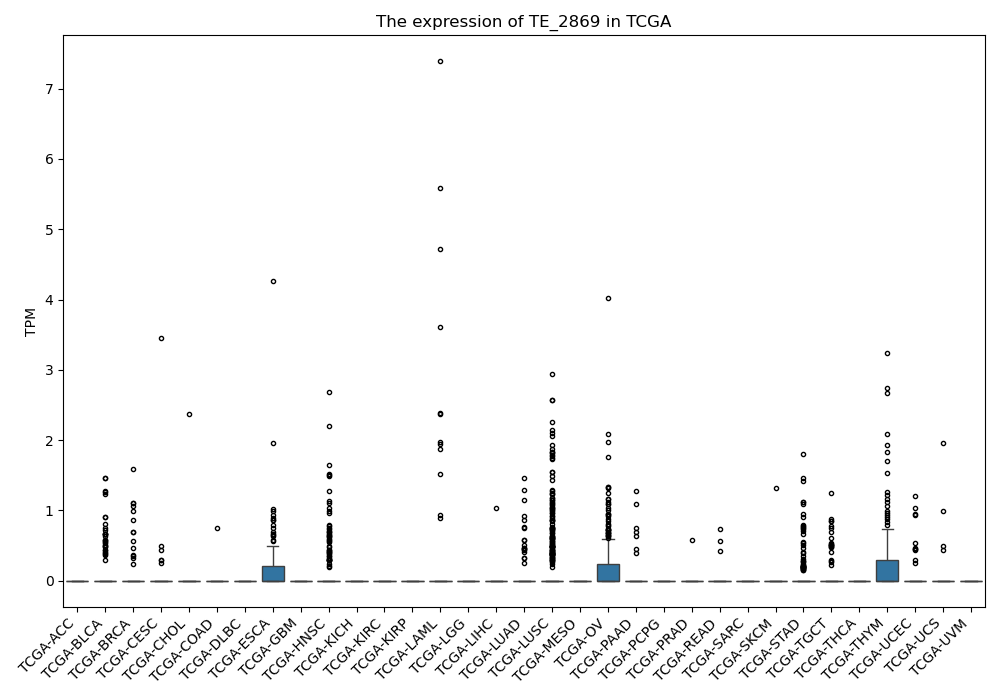
TCGA
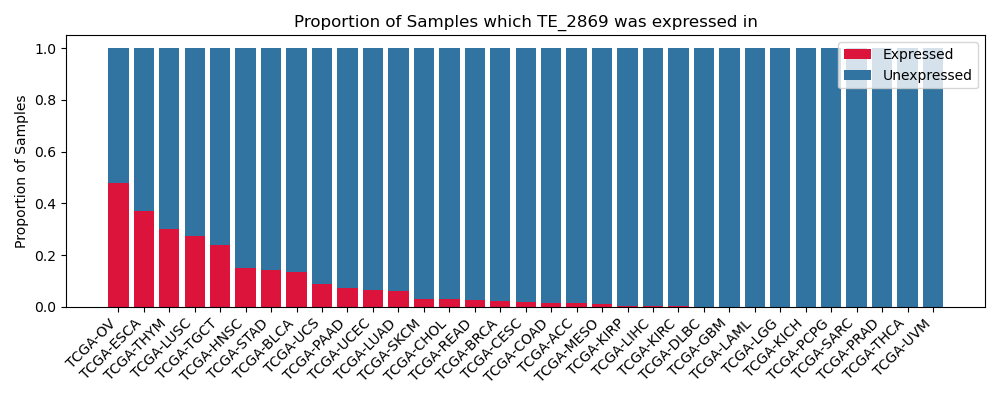
The proportion of samples in which the TE-initiated transcript was expressed across 33 cancer types from The Cancer Genome Atlas (TCGA).
GTEx
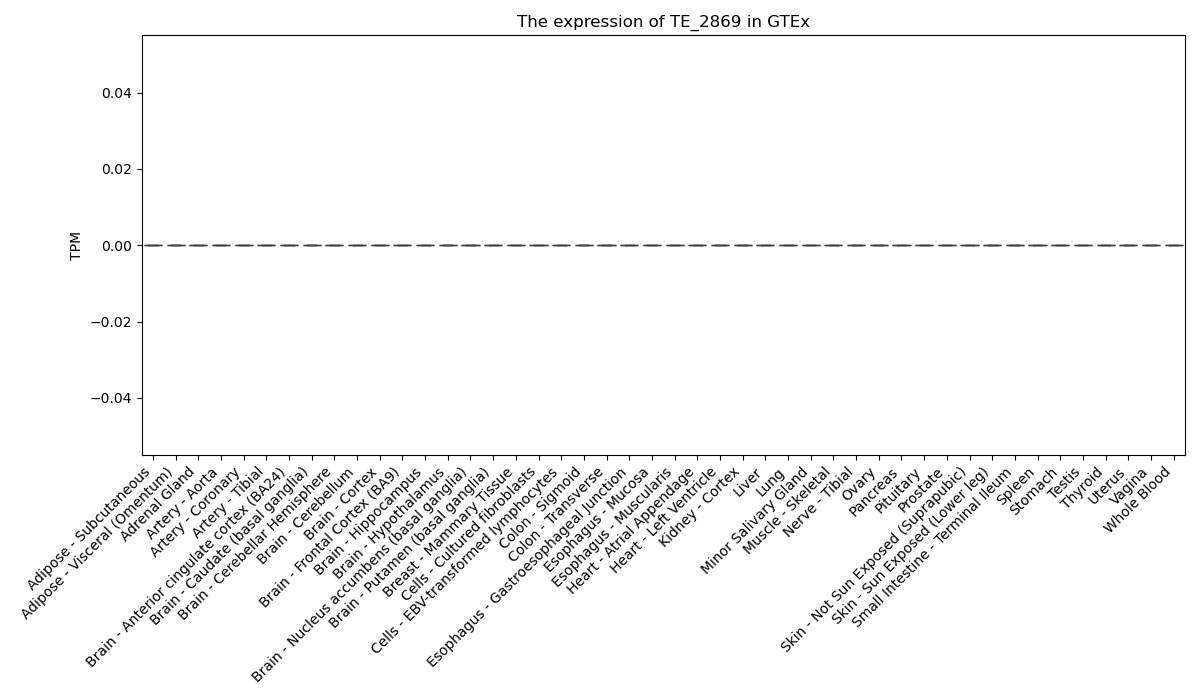
The expression of TE-initiated transcript across 46 body sites from The Genotype-Tissue Expression (GTEx) project.