TE_1435
Basic information Differential Expression Stage analysis Survival analysis Correlation analysis| TE family | L1ME2_3end |
|---|---|
| TE superfamily | L1 |
| TE order | LINE |
| Gene | ENSG00000285280 |
| Class | Chimeric |
| Coding | Non-coding |
| Tumor-specific score | 188.23 |
| Counts of samples | TCGA_tumor:166; TCGA_normal:0; GTEx:0 |
| TSS | chr1(-):192500569 |
Transcript isoforms
| Transcript_ID | Gene | Class | Coding | ORF | Position |
|---|---|---|---|---|---|
| teRNA_1435.1 | ENSG00000285280 | Chimeric | Non-coding | Non-coding | chr1(-):192387794,192387814,192476039,192476178,192489797,192489945,192491809,192491969,192500503,192500570 |
| teRNA_1435.2 | ENSG00000285280 | Chimeric | Non-coding | Non-coding | chr1(-):192387794,192387814,192476039,192476178,192489797,192489945,192491809,192491969,192493489,192493523,192500503,192500570 |
1
GTEx
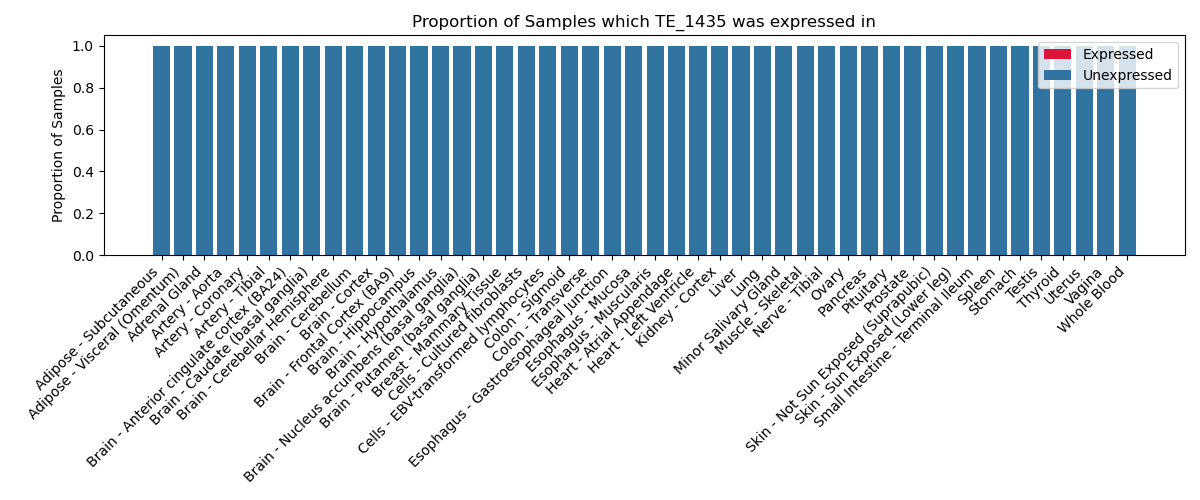
The proportion of samples in which the TE-initiated transcript was expressed across 46 body sites in the Genotype-Tissue Expression (GTEx) project.
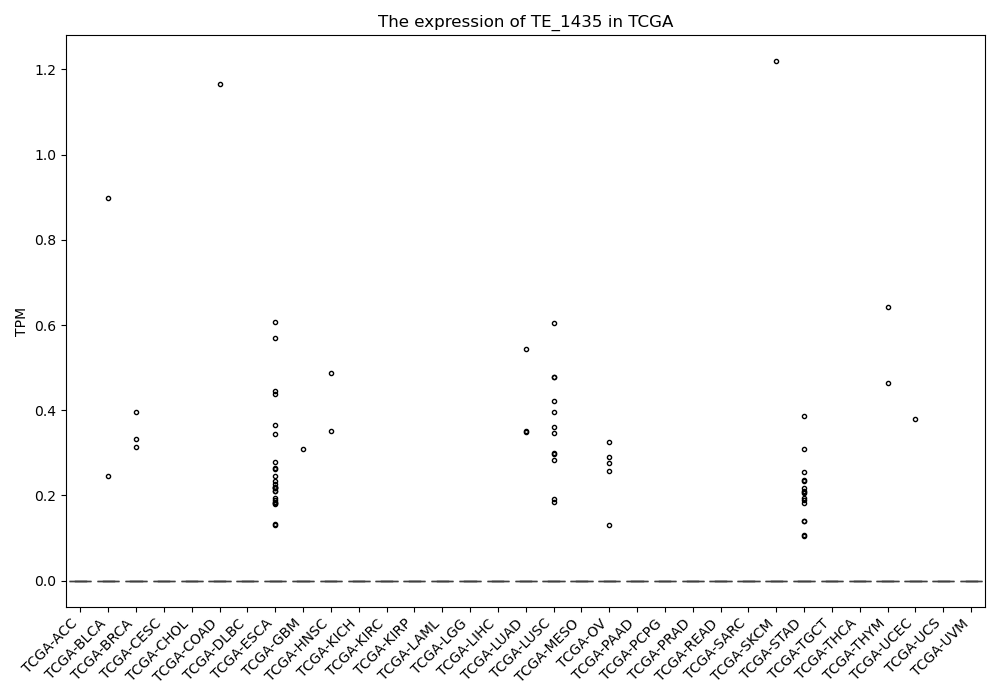
TCGA
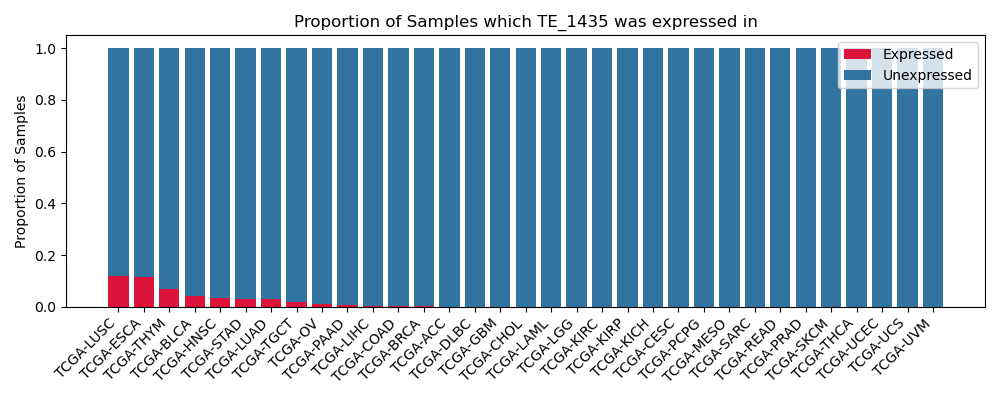
The proportion of samples in which the TE-initiated transcript was expressed across 33 cancer types from The Cancer Genome Atlas (TCGA).
GTEx
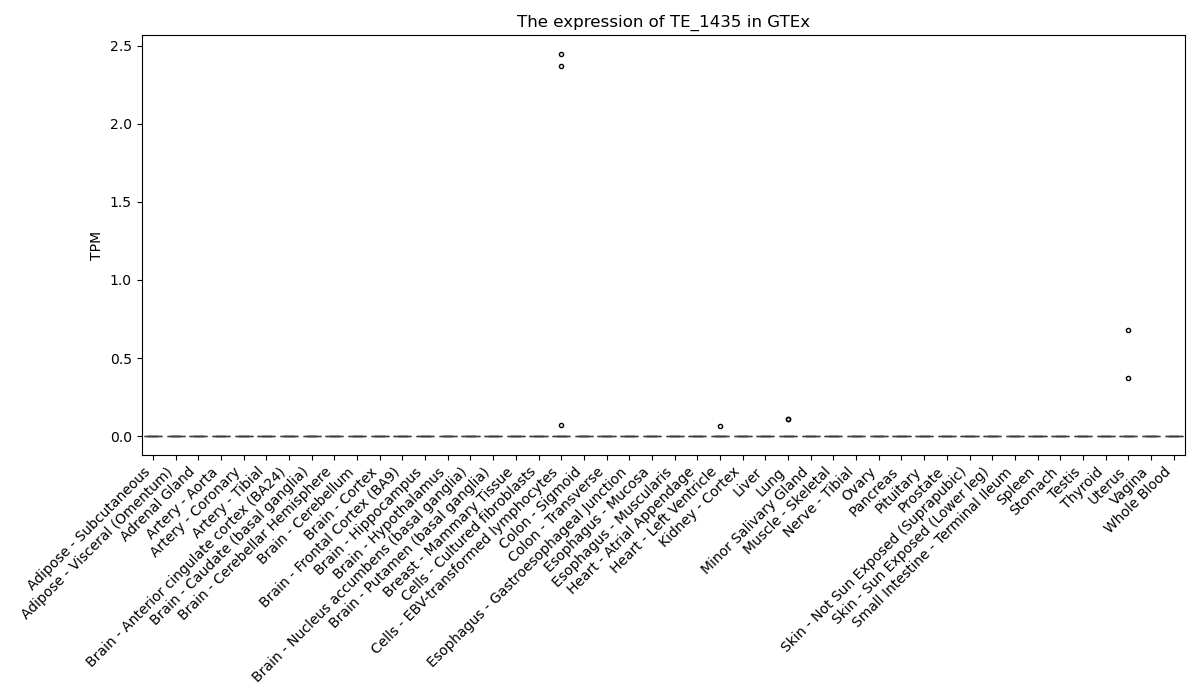
The expression of TE-initiated transcript across 46 body sites from The Genotype-Tissue Expression (GTEx) project.